Case report: Hey guys we had a patient with a complex surgical problem involving acute liver injury. The patient was actively bleeding internally and requiring MTP with initial vasopressor support. We needed to run TEG analysis to guide resuscitation and treatment efforts. Here are compiled information I gathered from the internet to simplify this topic on TEG interpretation.
WHAT IS TEG?
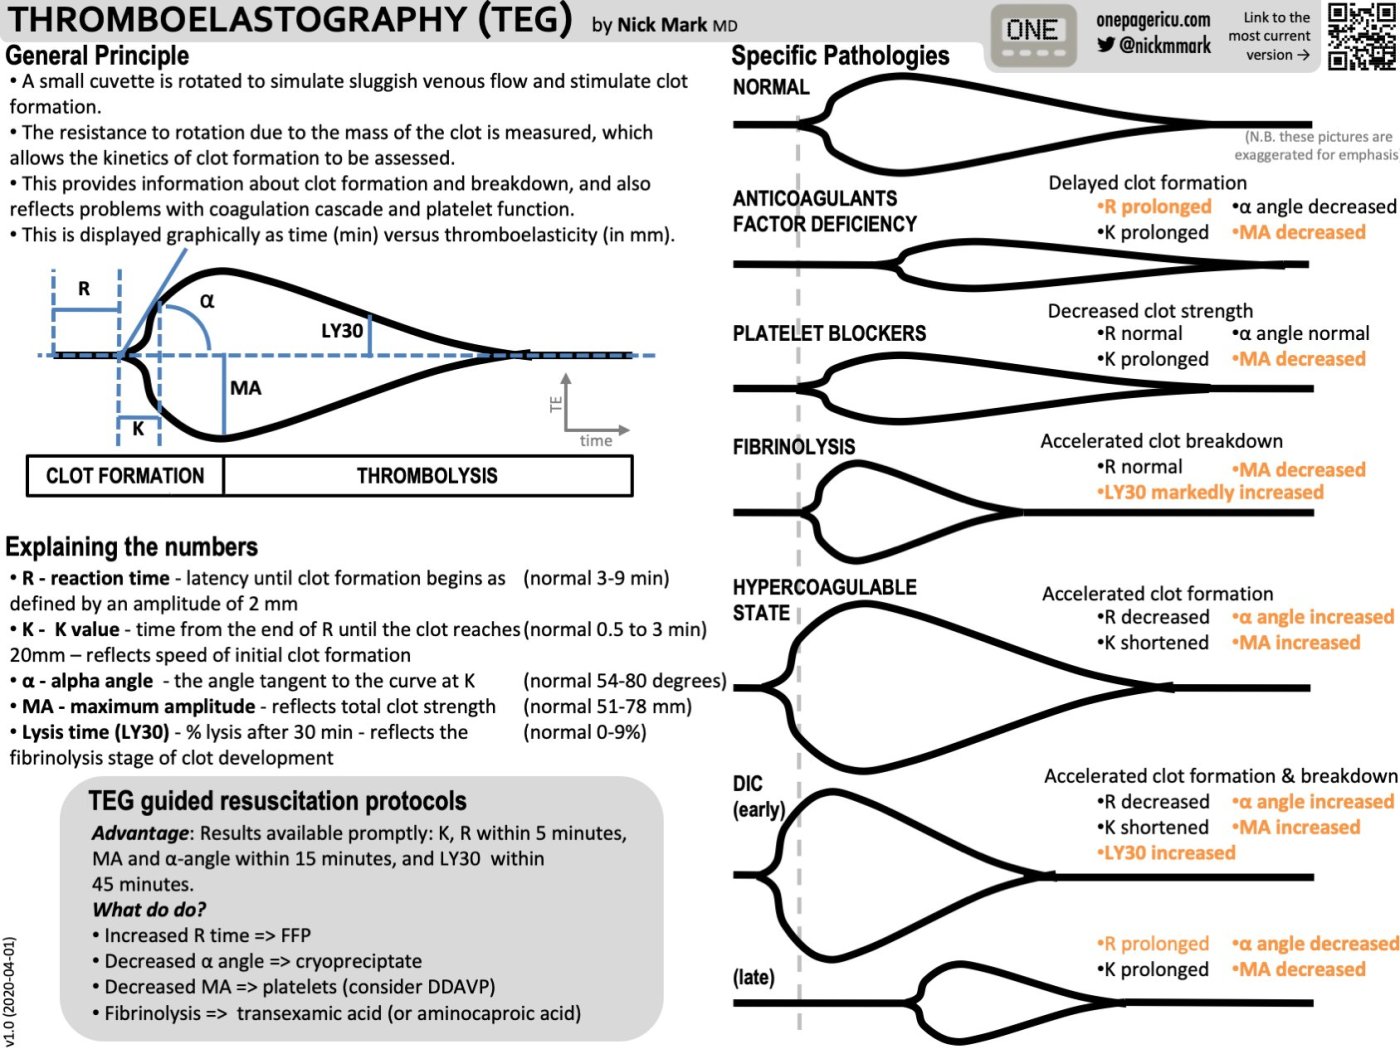
Thromboelastography (TEG) measures the dynamics of clot development, stabilization/strength, and dissolution. Assuming the body’s ability to achieve hemostasis is a function of these clot properties, TEG provides specific, real-time indicators of a patient’s in vitro hemostatic state. This is in contrast to routine screening coagulation tests such as aPTT and PT/INR which are run with blood plasma alone and therefore do not take into account the cellular components of clotting.
What Is a Viscoelastic Assay ?
During coagulation, blood transitions from a liquid to a solid state (thrombosis) and will naturally degrade back to a liquid (fibrinolysis). These changes can be assessed using viscoelasticity. Viscoelasticity is a composite measurement of viscosity and elasticity quantified by a force causing a deformity. A simplified analogy is mixing cement with a stick. As the cement hardens, the force required to push the stick increases. This increase in force represents the transition of the cement from a liquid to a solid. Therefore, the force required to move the stick in the hardening cement is a crude quantification of the viscoelastic strength of the cement over time. This is an overly simplified explanation of how these machines which, which involves physics beyond what a clinician needs to interpret a viscoelastic assay.
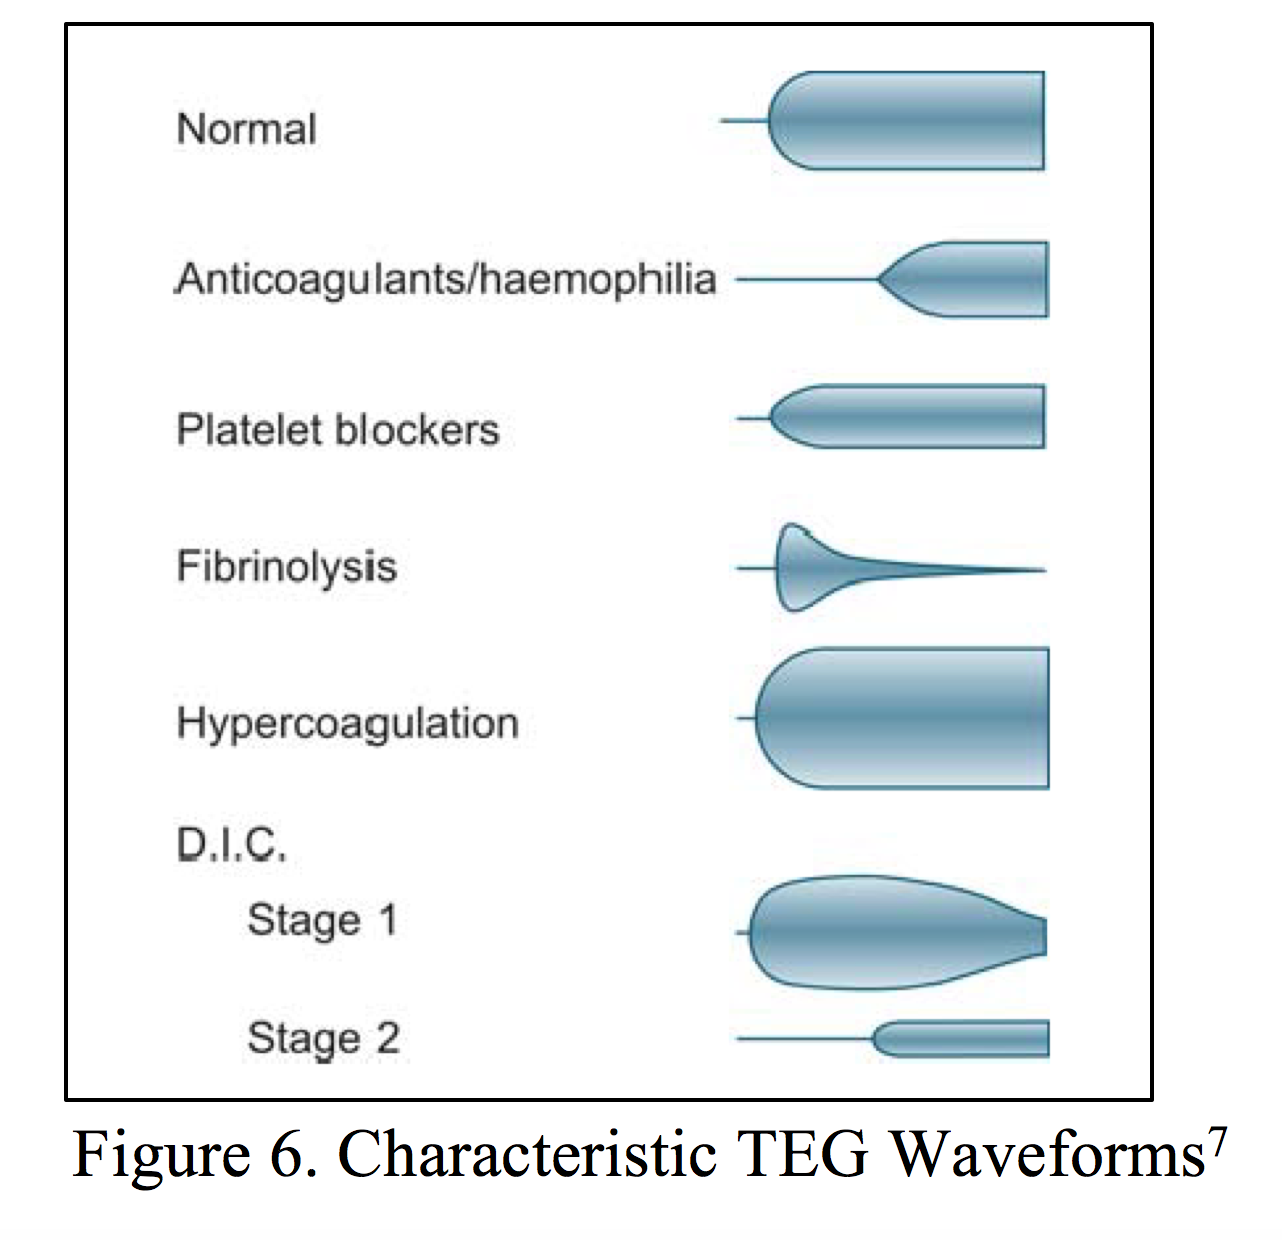
The most common methodology to cause deformity of blood (the stick in the cement) is with a pin and cup. Thrombelastography (TEG) uses a rotating cup to deform blood, while ROTEM uses a rotating pin in a stationary cup. Additional methodologies can be used, but are beyond the scope of this chapter. As blood transitions from a liquid to solid state, the shear strain created by polymerizing fibrin and platelet aggregation (increasing viscosity) is transmitted to the device. Resistance is then quantified by the machine, which is visualized on a display as a single line splitting into two. The distance between the two lines is proportional to viscoelastic resistance transmitted from the clot. This resistance is measured over time until the clot forms its maximum strength, represented by the two lines reaching their maximum amplitude and distance apart. This concludes the clot formation aspect of the device. After this point, the clot begins to lose strength through fibrinolysis, via cleavage of fibrin. The two lines’ amplitudes decrease, and are quantified over time. The end result of a viscoelastic assay is an hourglass-shaped tracing, which has numerous properties that can be calculated to approximate abnormalities of the different components of coagulation.
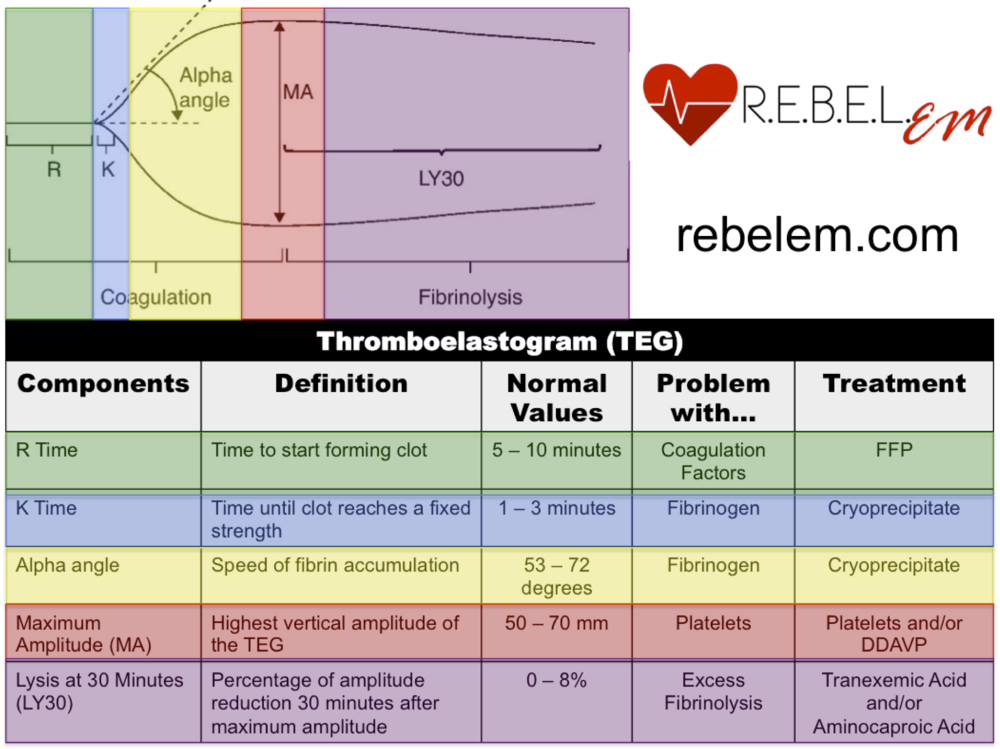
HOW TO READ A TEG
TEG creates a graphical representation of the movement of a small pin suspended in a cup of whole blood as hemostatsis occurs. As the blood begins to clot and adhere to the pin, the movement of the pin increases. This increasing movement is interpreted by the computer as increasing amplitude on the TEG graph.
Interesting facts: The first reported clinical application of the test occurred during the Vietnam War in an attempt to guide transfusions of blood components in injured soldiers. | https://www.ncbi.nlm.nih.gov/books/NBK537061/
Credit to the source(s): https://www.tamingthesru.com/blog/grand-rounds/teg | http://www.emdocs.net/thromboelastogram-teg-five-minute-primer-emergency-physician/ | http://www.thoracickey.com/tegrotem-driven-resuscitation-in-trauma/
Names, dates, and personal identifying details have been changed throughout this website to comply with the Health Insurance Portability and Accountability Act (HIPAA). **

Leave a comment